Reviews
Description
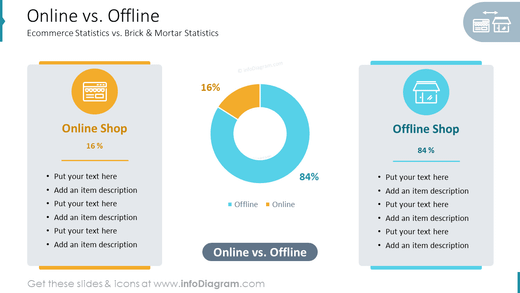
Online vs. Offline Ecommerce Statistics ### Slide Content: * Online vs.
Offline Ecommerce Statistics: This slide compares online and offline ecommerce statistics. * Online Shop: 16% - This represents the percentage of total retail sales that occur online. * Offline Shop: 84% - This represents the percentage of total retail sales that occur offline. * Brick & Mortar Statistics: 84% - This represents the percentage of total retail sales that occur at brick-and-mortar stores. * Ecommerce Statistics: 16% - This represents the percentage of total retail sales that occur through e-commerce channels. ### Graphical Look: * Simple and minimalist design. * White background with black and gray text and graphics. * Title at the top, pie chart centered. * Pie chart is labeled "Online" and "Offline," showing the percentage of total retail sales that occur through each channel. * Key for pie chart located below chart. ### Analysis of the PowerPoint slide: The slide uses a simple but effective design to communicate its message. The pie chart is the most prominent visual element on the slide, and it makes it easy to see the difference in online and offline retail sales. The key for the pie chart is clear and concise. Overall, the slide is well-designed and communicates its message effectively.
How to Edit
How to edit text & colors

How to expand / shorten diagram

How to Replace Icons in infoDiagram PPT

