Reviews
Description
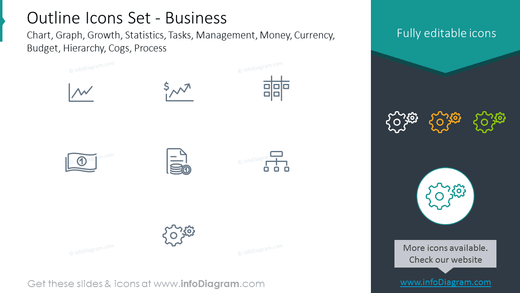
Outline Icons Set - Business
Slide Content
This slide is titled "Outline Icons Set - Business" and presents a collection of line icons related to various business concepts, including:
- Chart (representing data visualization)
- Graph (illustration of data trends)
- Growth (symbolizing business expansion)
- Statistics (data analysis representation)
- Tasks (depicting work or to-dos)
- Management (organizational structure symbol)
- Money (currency or finance symbol)
- Currency (representation of money or economics)
- Budget (financial planning)
- Hierarchy (organizational structure)
- Cogs (symbolizing machinery or processes)
- Process (a sequence of actions or steps)
These icons are noted as fully editable, suggesting they can be customized for different presentations.
Graphical Look
- The slide background is divided into two sections, light gray on the left and dark blue on the right.
- The slide title is at the top in large, bold font.
- A line of smaller text below the title explains the context of the icons.
- Nine icons are evenly distributed across the slide in a three-by-three grid.
- Each icon is in an outline style with limited detail for simplicity.
- The color scheme of the icons is monochrome, matching the gray background.
- Four brightly colored versions of one icon (a gear) are displayed in the blue area, with a highlighted icon encircled.
- A text block in the bottom right corner on the blue background suggests that more icons are available and points to a website.
The visual composition of the slide is clean and modern, with a clear distinction between the light and dark sections. The outline icons in monochromatic color against a simple background emphasize clarity and professionalism.
Use Cases
- To enhance business or financial presentations with relevant visual aids.
- For illustrating concepts in training materials regarding company structures or processes.
- As part of a pitch deck to highlight key areas of business performance or planning.
- To visually organize information in reports or information sheets distributed within an organization.
How to Edit
How to edit text & colors

How to expand / shorten diagram

How to Replace Icons in infoDiagram PPT

